
INDIANA, USA — New Plant Hardiness Zone maps updated by the US Department of Agriculture released this week show a drastically reduced Zone 5 throughout Indiana, while Zone 7 makes an appearance in other parts of southern Indiana for the first time.
That means what kind of plants thrive in your garden, whether perennial or annual, have undergone a marked shift in recent years.
Plant Hardiness Zone maps are used to show gardeners and growers which plants are most likely to thrive in your area, by highlighting which plants are most likely to survive the coldest winter temperatures at certain locations.
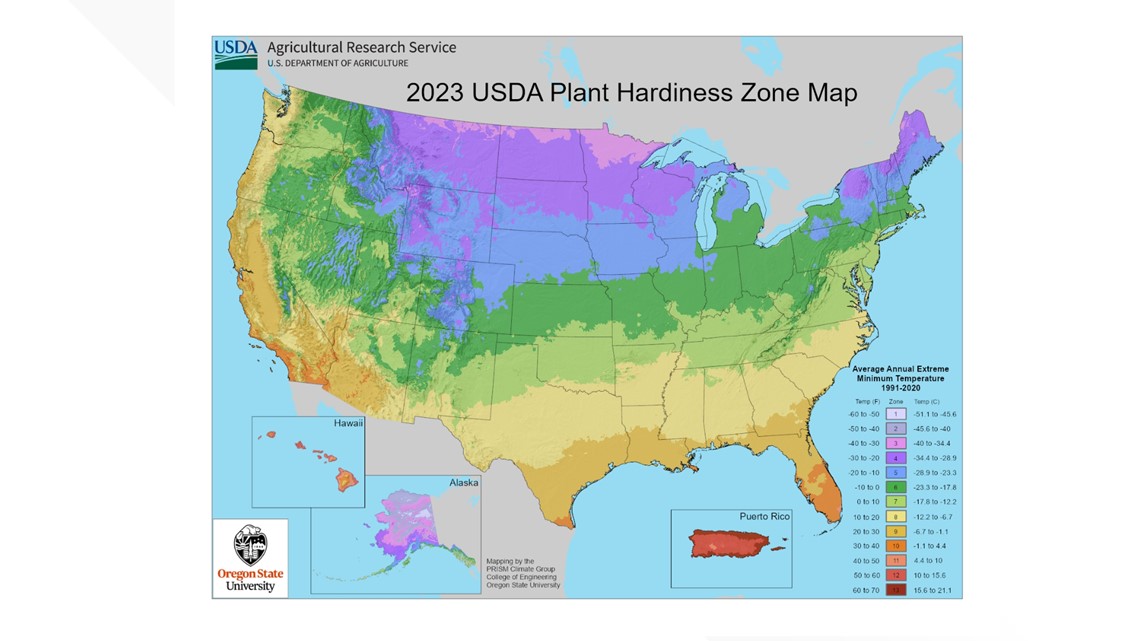
The 2023 map uses data from 13,412 weather stations, while the 2012 map utilized 7,983 of the weather stations - a 68% increase overall that makes the current map more accurate, according to the USDA. The department claims it is more accurate, detailed, and incorporates data from 13,412 weather stations versus 7,983 used for the 2012 version—a 68 percent increase in these stations.
The 2023 map is about 2.5 degrees warmer than the 2012 map across the continental United States. This translated into about half of the country shifting to a warmer 5-degree half zone, and half remaining in the same half zone. The central plains and Midwest generally warmed the most, with the southwestern U.S. shifting zones very little, according to the USDA.
The Plant Hardiness Zone Maps are based on the average annual extreme minimum winter temperature, a region’s 10 coldest nights over a 30-year period.
In 10-degree increments, the zones range from the coldest in Zone 1, Yukon, Siberia, and parts of Alaska - to the warmest Zone 13, Puerto Rico locations and some remote parts of Hawai'i.
Zones are further broken up into half zones, A and B. In comparison to the 2012 maps, the 2023 map shows nearly half of the US shifted up a half zone, and the other half remained in the same half zone. Areas that shifted to the next warmer half zone signifies those areas warmed somewhere between 0-5 degrees.
The USDA said temperature updates to plant hardiness zones are "not necessarily reflective of global climate change" because of the "highly variable nature of the extreme minimum temperature of the year", and the use of increasingly sophisticated mapping methods and the inclusion of data from more weather stations.
But experts who spoke with 13News interpreted the map differently.
"Climate is, by definition a 30-year average of a weather variable, which is what this is. We've got two different sets of 30 years that we're looking at, whether we look at the 2012 or 2023 map. So, that is classic, textbook definition of climate change," said conservation agronomist Hans Schmitz, who works for the Purdue Extension in the Conservation Cropping Systems Initiative and is an affiliate of the Indiana State Climate Office.

So, what does this mean for Hoosier growers?
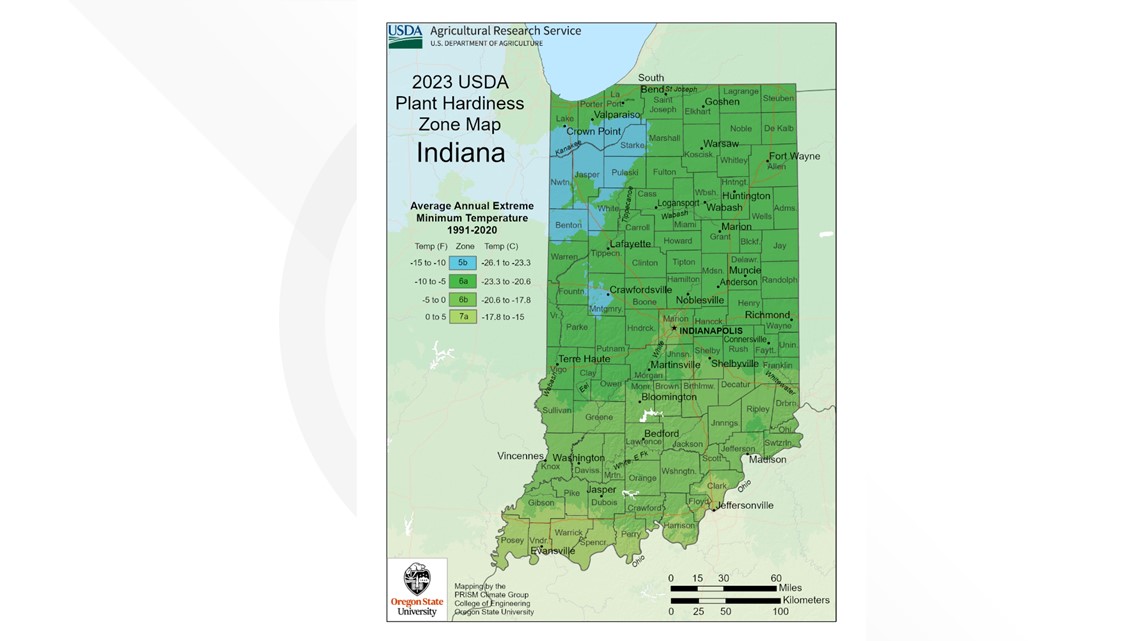
Zone 5 that used to encompass most of northern Indiana shrunk significantly with the new map. Zone 7, which we hadn’t seen in Indiana before, now covers most of the Ohio Valley in southern Indiana.
“Before these new maps, the entire state of Indiana could expect to see sub-zero temperatures at some point. Zone 7, and 7A in particular is 0 to 5 degrees F. So the Ohio Valley, extreme southern Indiana, no longer on average experiences subzero temperatures,” Schmitz said.
Most of Indiana is in Zone 6a or 6b. Some parts of Benton, Jasper, Pulaski, Starke, Valparaiso and Lake counties are in Zone 5b. Parts of Evansville and the Ohio Valley are in 7a.
Schmitz said the maps generally matter most to gardeners who may have recently moved to a different location or have not resided in their gardened area for a length of time. The longer you garden in a certain zone, experience in knowing which plants thrive make up for what the maps may indicate.

"If you look at experienced gardeners, they're going to know their landscape. It's not going to affect them nearly as much as somebody who's used to Tennessee plantings and has now moved to Noblesville," Schmitz said.
Abut 80 million American gardeners and growers represent the most frequent users of the USDA Plant Hardiness Zone Map, according to the department. However, the USDA Risk Management Agency also refers to the map’s plant hardiness zone designations to set certain crop insurance standards.
Scientists likewise incorporate the plant hardiness zones as a data layer in many research models, such as those modeling the spread of exotic weeds and insects.
Here are some examples of Zone 5 hardy plants.
Here are some examples of Zone 6 hardy plants.
Here are some examples of Zone 7 hardy plants.