

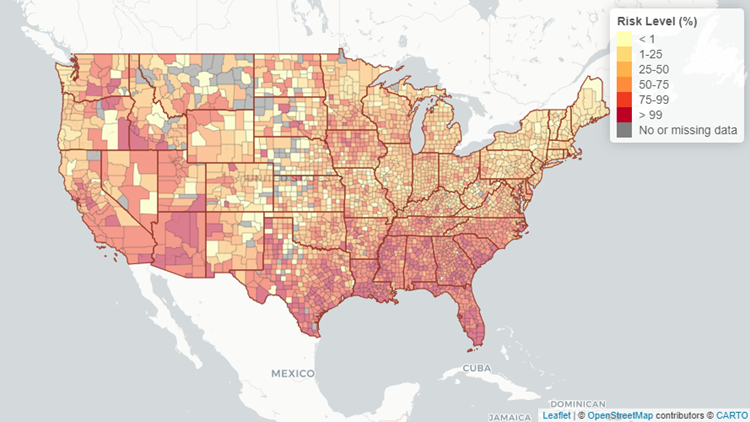
A new tool developed by Georgia Tech allows people to look up their risk of encountering COVID-19 at event, based on the county they live in.
The interactive map allows users to choose a county anywhere in the United States, choose the event size (anywhere from 10 people to 10,000), and then calculate the risk that at least one COVID-19 positive person will be present.
For example, in Marion County, the tool calculates that at a 100-person event, there is an 58% chance that someone in attendance will be COVID-positive. At a gathering with only 10 people, that risk goes down to 8%.
In Warren County on the state's western border, the risk level is less than 1% at a gathering with 100 people in attendance. Alternatively, the risk is 97% in two Indiana counties: Elkhart and Marshall.
The interactive map is based on data from The COVID Tracking Project at The Atlantic, which pulls daily data on COVID-19 testing and patients from all 50 states. It's also based on 2019 U.S. Census data.
The risk assessment tool was developed by researchers at Georgia Tech's Institute of Technology, Biological Sciences (GT-BIOS) and the Applied Bioinformatics Laboratory (ABiL).