
INDIANAPOLIS — Indiana is significantly more diverse in 2020 than in 2010. That echoes numbers seen in states around the country.
Those numbers could help determine control of the House in the 2022 elections and provide an electoral edge for years to come. The data will also shape how $1.5 trillion in annual federal spending is distributed.
They also show how diversity in the country is changing. The 2020 census found the white population is aging and has fallen to its smallest share of the total population on record.
Indiana also saw diversity dramatically increase from 32.3% in 2010 to 41.2% ten years later.
Indiana racial or ethnic groups
- White/Not Hispanic or Latino – 75.5%
- Black or African American – 13%
- Hispanic or Latino – 8%
In 2010, white people made up 84.3% of the population in Indiana. Black people saw a population increase of 13% and Hispanic or Latino of 8%.
Most diverse counties
The most diverse counties in the state were Marion, Lake, St Joseph, Allen and Tippecanoe.
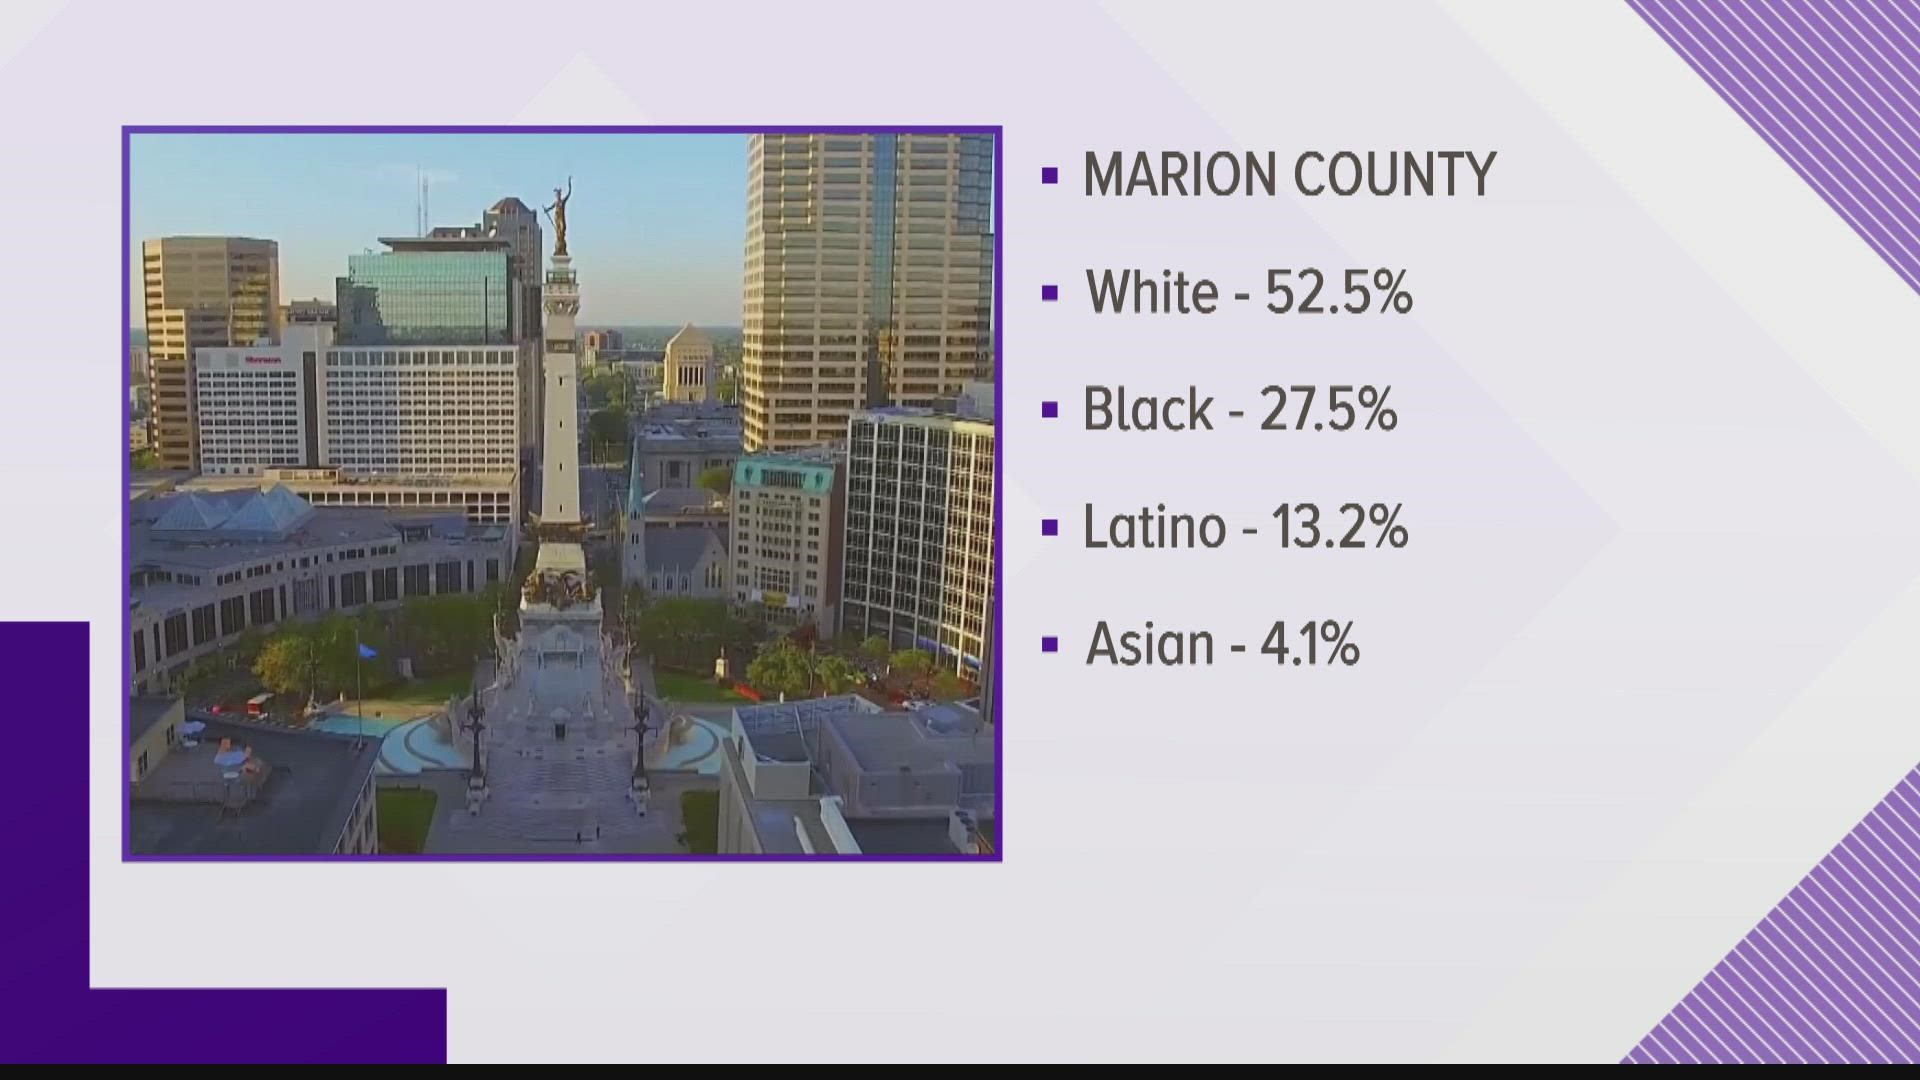
In Marion County, white people accounted for 52.5% of the population. Black people make up 27.5% and Hispanic or Latino 13.2%.
Marion County is also approaching a population of a million people (977,203).
Counties with largest population increase
The counties in Indiana that saw the largest population growth are all in the Indianapolis metro area.
- Hamilton: 26.5%
- Boone: 25.0%
- Hendricks: 20.2%
- Johnson:15.8%
- Hancock: 14.1%
Hamilton County's growth ranks it 54th in the nation. Boone County is not far behind, ranking 63rd.
Counties seeing population loss
The five Indiana counties that saw the largest population loss are:
- Switzerland: -8.3%
- Greene: -7.1%
- Parke: -6.8%
- Pulaski: -6.6%
- Randolph: -6.4